
Medium
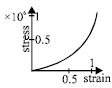
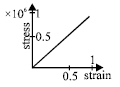
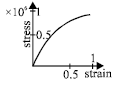
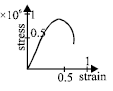
The stress vs. strain curve for the elastic tissue of the aorta,the large tube (vessel) carrying blood from the heart,will be: [Note: Stress is proportional to the square of the strain for the elastic tissue of the aorta.]
- A
- B
- C
- D
Explore More
Similar Questions
The strain-stress curves of three wires of different materials are shown in the figure. $P, Q$ and $R$ are the elastic limits of the wires. The figure shows that
Medium
View SolutionThe potential energy $U$ between two molecules as a function of the distance $X$ between them is shown in the figure. The two molecules are
Medium
View SolutionThe stress-strain curves are drawn for two different materials $X$ and $Y$. It is observed that the ultimate strength point and the fracture point are close to each other for material $X$ but are far apart for material $Y$. We can say that materials $X$ and $Y$ are likely to be (respectively)
In the given stress-strain graph,what does point $D$ indicate?
Easy
View SolutionThe figure shows the graph between stress and strain for a uniform wire at two different temperatures. Then:
Medium
View SolutionVedclass Products
For Students
Vedclass Test Series
Mock tests in real JEE/NEET style with performance analysis. 5-day free trial.
Start Free TrialFor Teachers
Exam Paper Generator
Generate Set A/B/C/D exam papers from 7.5L+ questions in 2 minutes. 3 chapters free.
Try FreeFor Institutes
Online Exam Module
Live online exams with unlimited students, 360° analytics & white-label branding.
See Demo